The purpose of this page is to clarify some concepts, notation, and terminology related to factorial experimental designs, and to compare and contrast factorial experiments to randomized controlled trials (RCTs). A more in-depth introduction can be found in Chapter 3 of Collins (2018).
There is also a factorial experiment FAQ and a page that examines misconceptions about factorial experiments.
Hypothetical factorial experiment
Suppose an investigator is interested in examining three components of a weight loss intervention. The three components are
- Keeping a food diary (yes or no);
- Increasing activity (yes or no); and
- Home visit (yes or no).
The investigator plans to manipulate each of these components experimentally. Thus, each becomes an independent variable.
Basic information, notation and terminology
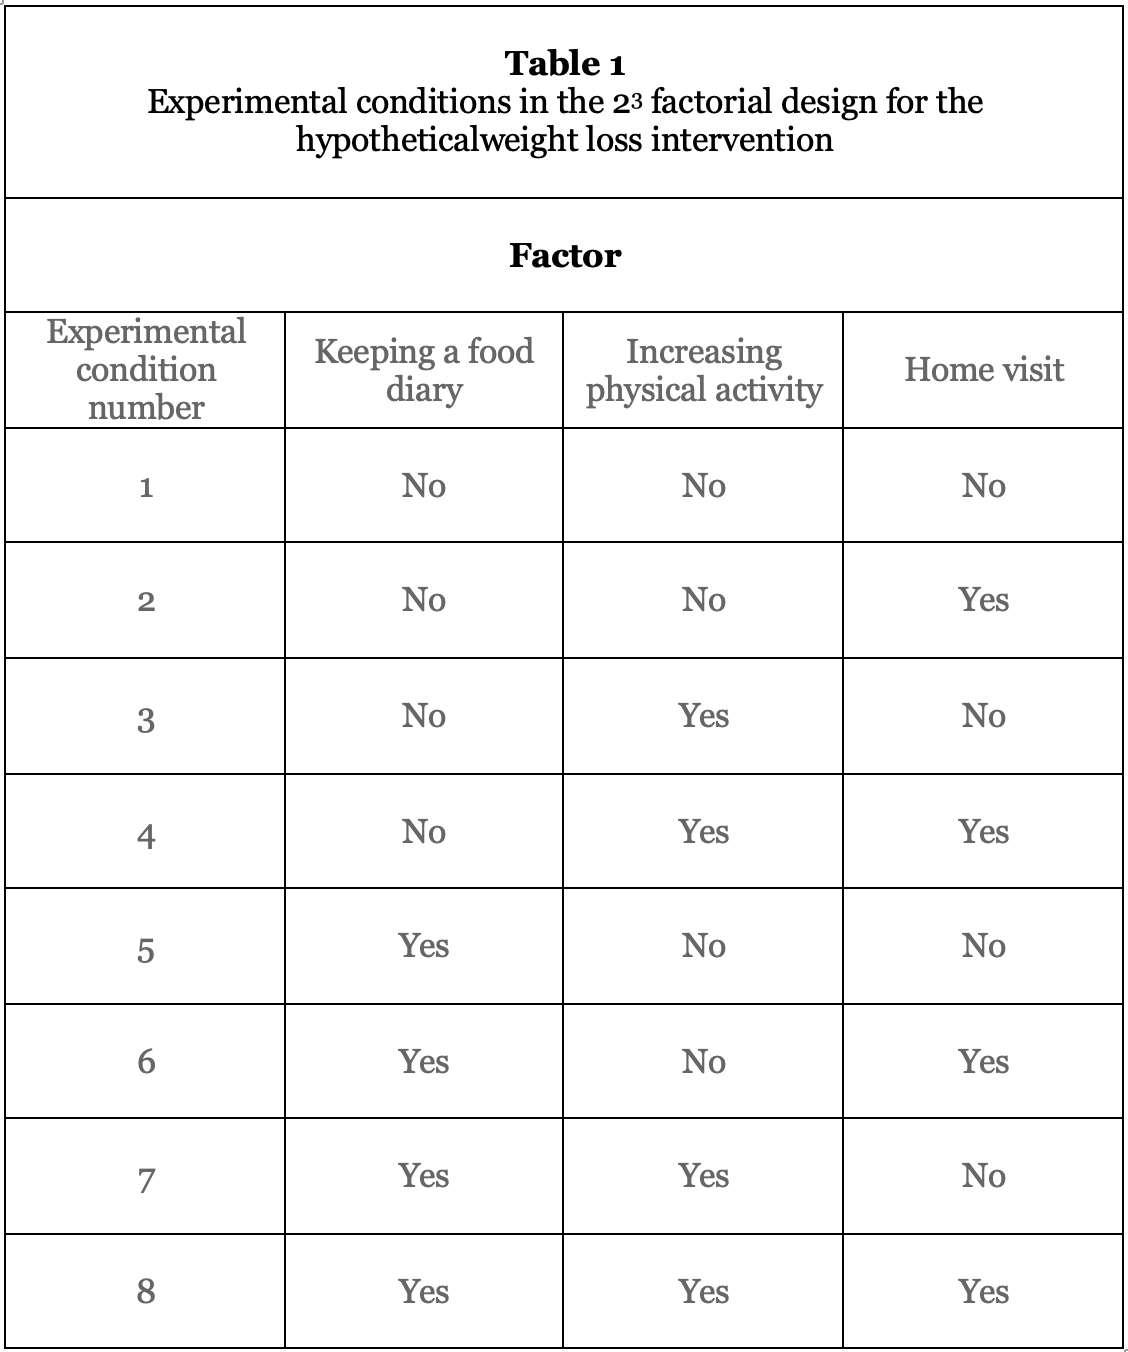
The investigator plans to use a factorial experimental design. Each independent variable is a factor in the design. Because there are three factors and each factor has two levels, this is a 2×2×2, or 23, factorial design. This design will have 23=8 different experimental conditions. Table 1 below shows what the experimental conditions will be.
The notation used to denote factorial experiments conveys a lot of information. When a design is denoted a 23 factorial, this identifies the number of factors (3); how many levels each factor has (2); and how many experimental conditions there are in the design (23=8). Similarly, a 25 design has five factors, each with two levels, and 25=32 experimental conditions; and a 32 design has two factors, each with three levels, and 32=9 experimental conditions. Factorial experiments can involve factors with different numbers of levels. A 243 design has five factors—four with two levels and one with three levels—and has 16×3=48 experimental conditions.
We will concentrate on designs in which all the factors have two levels. For experiments aimed at building behavioral interventions, we strongly recommend sticking with factors with two levels wherever possible, because these designs tend to be the most efficient for this purpose and also the most straightforward. Of course, the science has to drive the choice of experimental design, but efficiency is also an important consideration.
Conducting the factorial experiment
Let’s return to the 23 design in Table 1. To conduct this experiment, the investigator would randomly assign individuals to each of the eight experimental conditions. Each experimental condition in this design represents a different treatment protocol. For example, the individuals randomly assigned to Condition 2 would receive a home visit, but neither of the other two intervention components. Those randomly assigned to Condition 7 would receive the keeping a food diary and increasing physical activity components, but would not receive a home visit.
Differences between factorial experiments and RCTs
In an RCT there are a very limited number of experimental conditions (“arms” in RCT terminology)—usually just two or three—and the objective is to compare the individual experimental conditions to each other directly. By contrast, in a factorial experiment the objective is generally not to compare individual conditions to each other. (I’ve found that this is very counterintuitive for many intervention scientists!) Instead, for most effects, combinations of experimental conditions are compared.
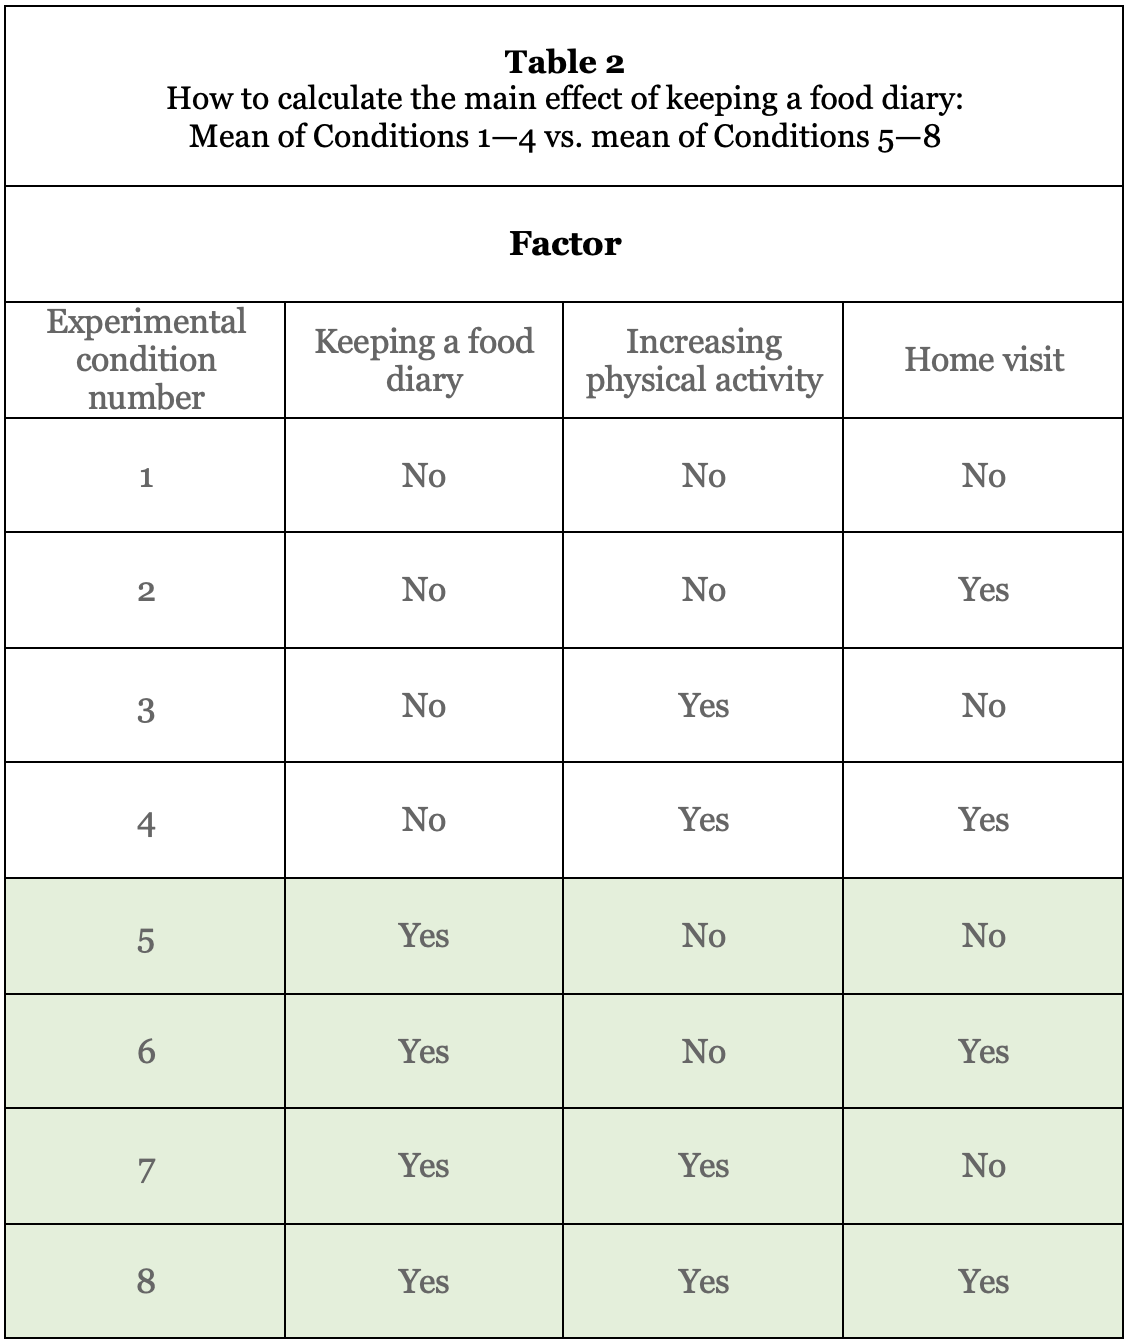
For example, to estimate the main effect of keeping a food diary, you would compare the mean of all of the conditions in which keeping a food diary is set to No (Conditions 1—4) to the mean of all of the conditions in which keeping a food diary is set to Yes (Conditions 5—8). In Table 2, this is the mean of the unshaded conditions compared to the mean of the shaded conditions.
Now let’s consider the main effect of a different factor, increasing physical activity. This would be obtained by comparing the mean of the conditions in which the increasing physical activity component is included (1,2,5, and 6) to the mean of the conditions in which this component is not included (3,4,7, and 8). In Table 3, this is the mean of unshaded conditions compared to the mean of the shaded conditions.

Note that in both of these main effect comparisons, all of the experimental subjects are used. They are just rearranged to make each comparison, in a sort of “recycling” of subjects. For example, when the main effect of keeping a food diary is estimated, the subjects in experimental conditions 3 and 4 are in the No level. Then, when the main effect of increasing physical activity is estimated, these same subjects are in the Yes level. This is one reason why factorial experiments are so efficient for examination of individual intervention components.
Powering RCTs compared to factorial experiments
In a standard two-arm RCT there is only one effect of interest, the treatment-control difference. The appropriate sample size is determined by assessing the expected effect size associated with the treatment-control difference, and then choosing a sample size so that power is maintained at the desired level.
Factorial experiments are typically powered to detect main effects (although it is frequently possible to power for detection of interactions; see Chapter 4 in Collins, 2018). In our hypothetical example, there are three main effects, one associated with each of the three factors. These main effects may vary in size. Here the appropriate effect size is determined by assessing the expected size of each of these main effects and identifying the smallest one. Then a sample size is chosen so that the power associated with this smallest effect size is maintained at the desired level. Suppose the expected effect sizes for each of the factors in the hypothetical example can be expressed in terms of Cohen’s d as follows: keeping a food diary: d=.15; increasing physical activity: d=.12; home visit: d=.17. The sample size needed for the experiment would be determined using the smallest effect size: d=.12 (for increasing physical activity). With this sample size, the power associated with the other factors will be maintained at approximately the same level or better.
Let’s review a critical difference between factorial experiments and RCTs. The difference concerns what happens to the sample size requirements if we decide we want to add an experimental condition to an RCT versus what happens if we decide we want to add a factor to a factorial experiment.
Consider an RCT with two experimental conditions, a standard control condition and a treatment condition. We will call the treatment condition Treatment A. Suppose a power analysis suggests that 300 subjects per condition is sufficient, for a total N=600.
Now suppose you want to compare an additional treatment, Treatment B, in this experiment. This would now be a three-arm RCT. Assuming the power analysis is based on the same effect size, you would need to add 300 more subjects to the experiment, for a total N=900. In general, whenever an arm is added to an RCT that has n subjects per arm, it is necessary to increase the number of subjects by at least n in order to maintain adequate power.
In contrast, suppose you wanted to add a fourth factor, decreasing screen time, to the factorial weight loss intervention experiment described above. Suppose the new decreasing screen time factor is expected to have a main effect size of d=.14. Because the original power analysis was based on an effect size of d=.12, it would not be necessary to increase the sample size to maintain adequate statistical power when adding a fourth factor. In general, when one or more additional factors are added to a factorial experiment, the sample size requirements change very little or not at all, as long as the smallest expected effect size does not change, and the number of levels in the new factor does not exceed the largest number of levels included in a factor already in the experiment (in the example, 2). However, the number of experimental conditions in the design will increase. In the example, if decreasing screen time has two levels, the number of experimental conditions will double. The new design will have 24=16 experimental conditions.
A lot of people seem to think that factorial experiments require huge amounts of experimental subjects. Maybe they think of a factorial experiment in RCT terms, and therefore think that ultimately the experimenter will be comparing individual experimental conditions. From this perspective, an experiment like the one in Table 1 is essentially an 8-arm RCT, and would require a large N. We have seen a number of conference presentations in which intervention scientists say they conducted a factorial experiment, usually a 2×2, and then analyzed the data as if it came from an RCT, with no justification of the analytic approach. This adds to the considerable confusion.
Summary
When choosing an experimental design, one important consideration is which one delivers the most statistical power with the fewest subjects. If the research questions call for direct comparison of individual experimental conditions, as is required when treatment packages are being compared, then this design will usually be an RCT. If the research questions call for assessing the effects of individual components of an intervention, then this design will usually be a factorial experiment.
Did this page raise questions? View the factorial experiment FAQ page.
Did this contradict things you have heard about factorials? Go to the misconceptions about factorial experiments page.
Reference:
Collins, L.M. (2018). Optimization of behavioral, biobehavioral, and biomedical interventions: The multiphase optimization strategy (MOST). New York: Springer